global change biology, environmental data science, phenology, climate change, forecasting, GPEDM, machine learning, public health, pollen, wind-pollinated species
Highlights
We aimed to deliver near-term forecasts of vegetative and reproductive phenology of wind-pollinated plants that induce allergy.
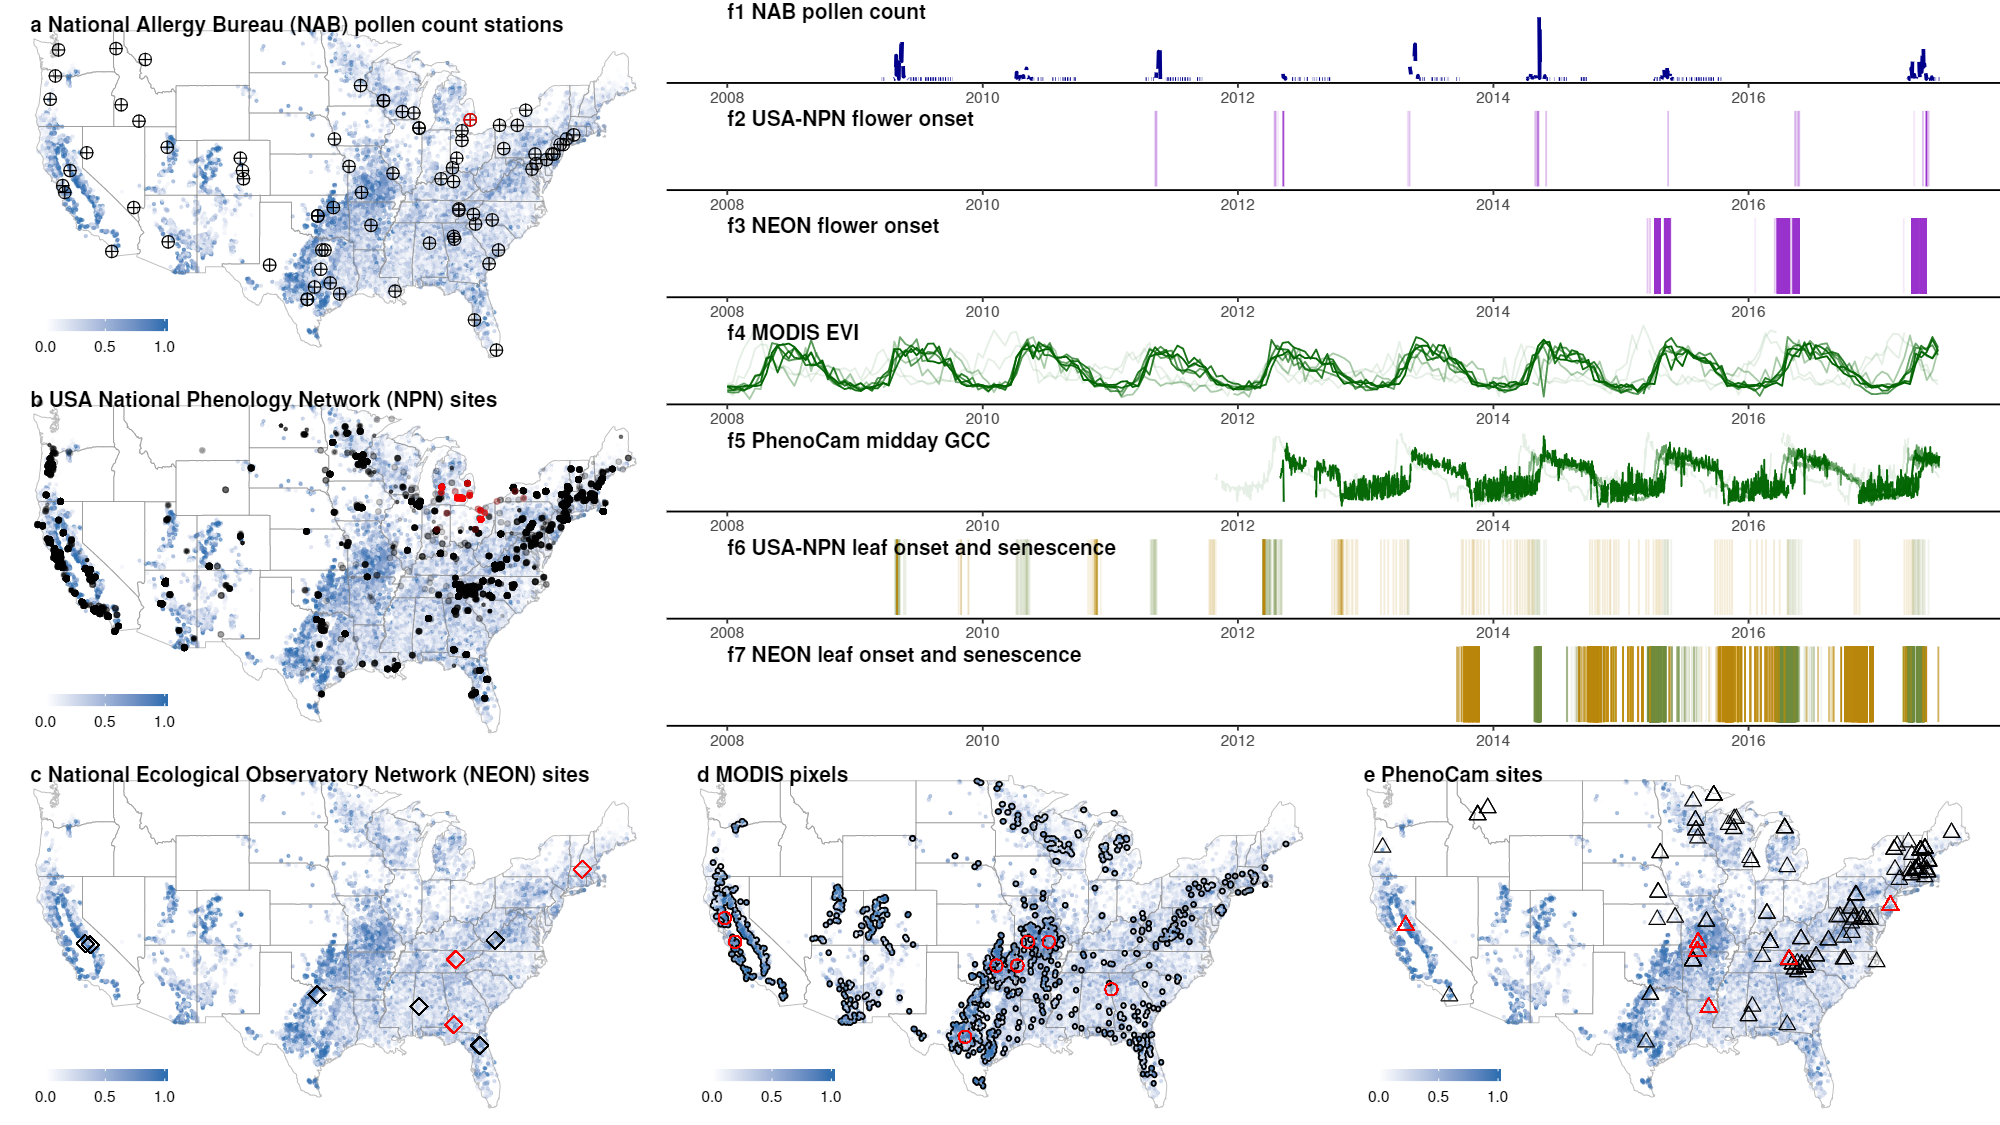
We leveraged diverse phenology data including remote sensing, phenophase observations, and airborne pollen concentrations.
We used spatiotemporal Gaussian Process Empirical Dynamic Modeling (GPEDM) to forecast maps of phenology in the continental US.
We implemented infrastructure to deliver forecasts every day for the following 35 days on our web app, PhenoForecast.
Background
Synthesizing phenology data from multiple sources.
Methods
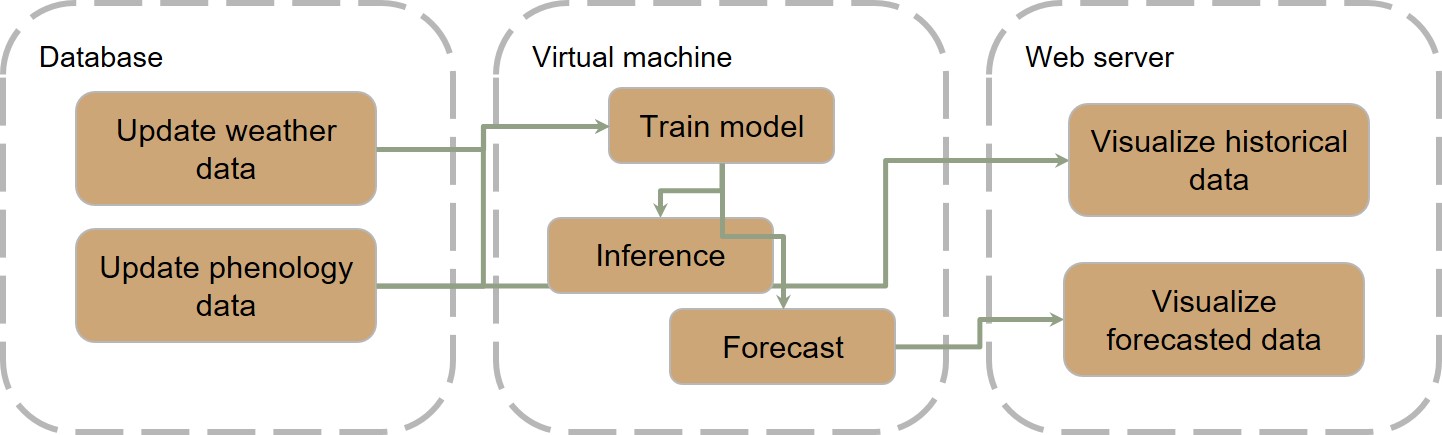
Infrastructure to collect data, fit models, make predictions, and deliver forecasts.
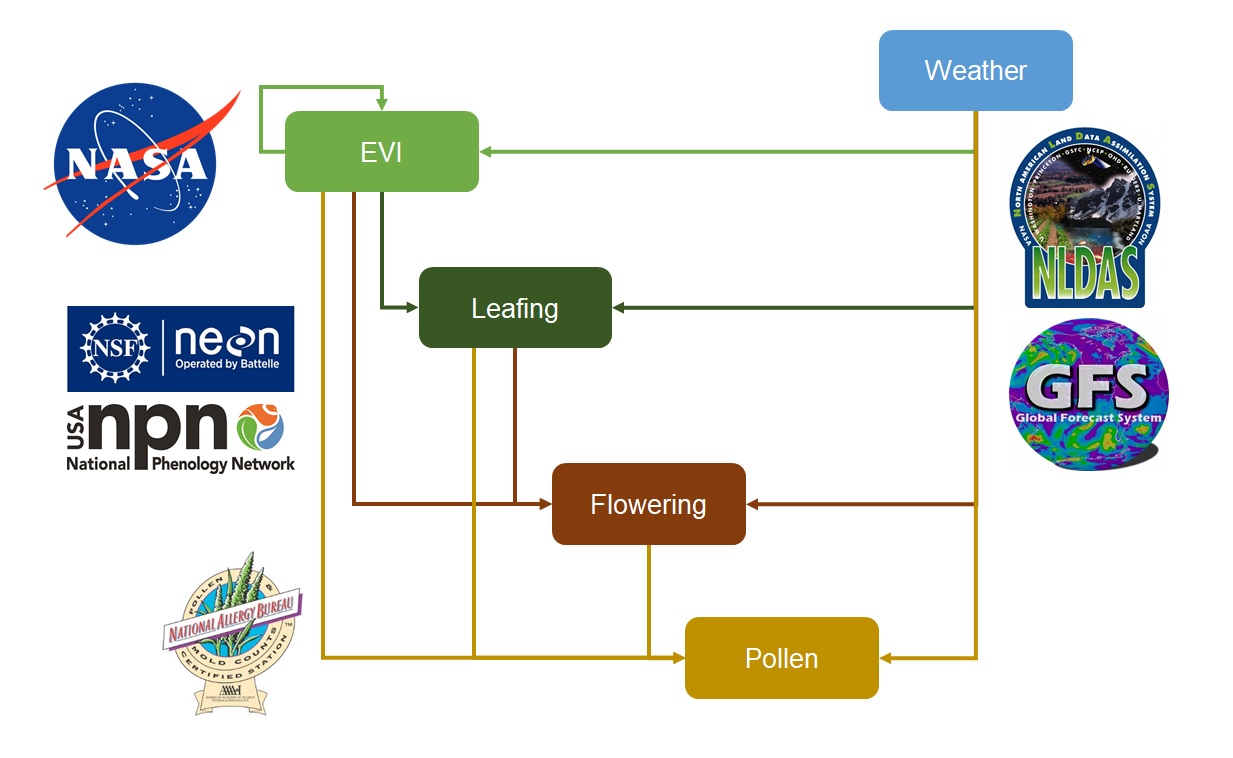
Four levels of the model behind PhenoForecast and key data sources.
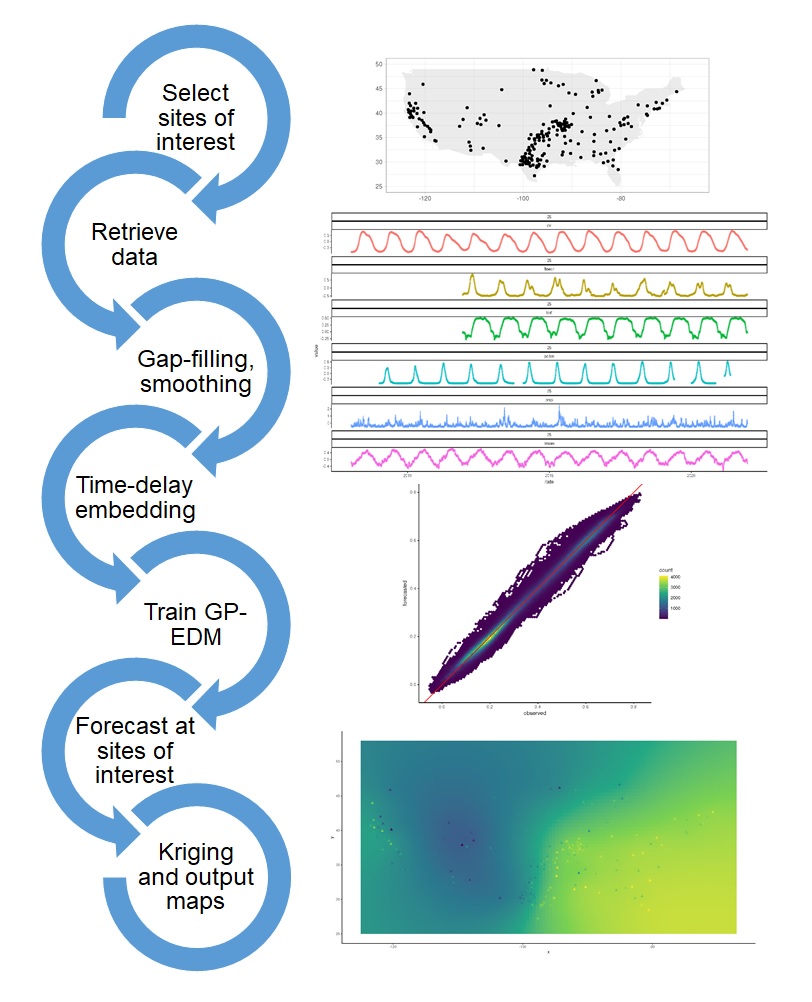
Steps in each level of the model.
Product
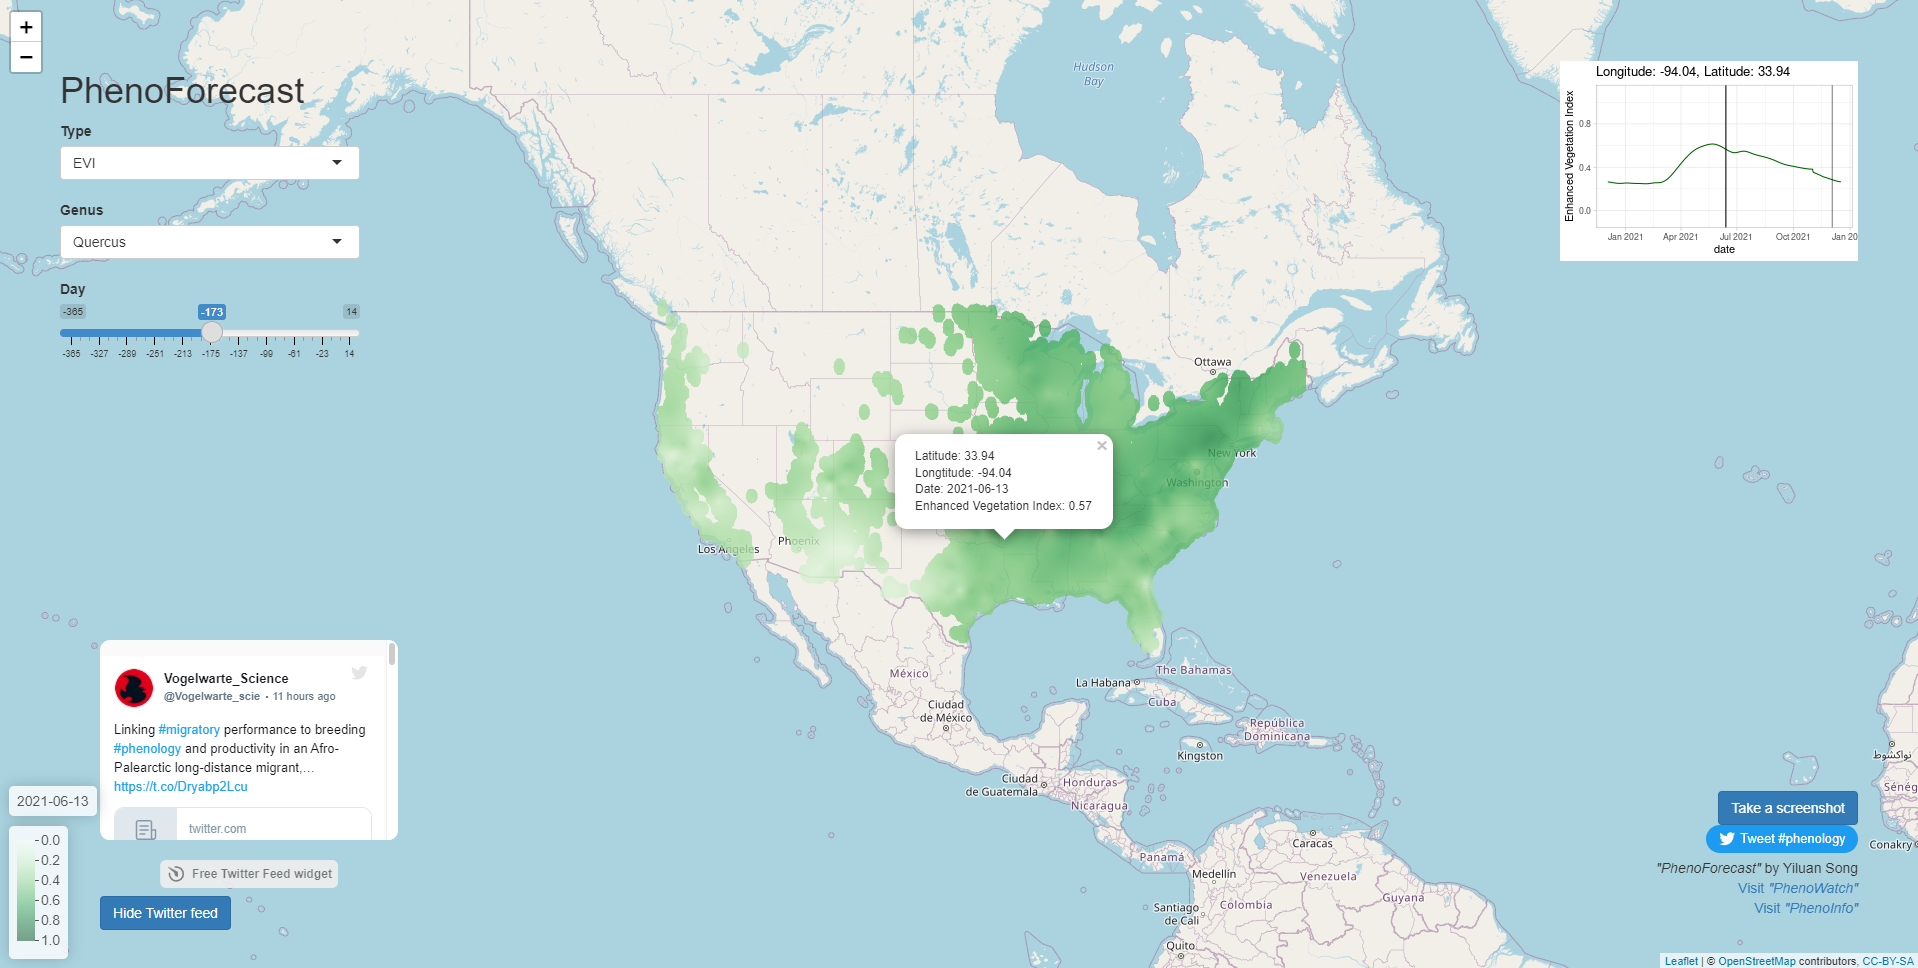
Screenshot of PhenoForecast, showing forecasts of EVI.
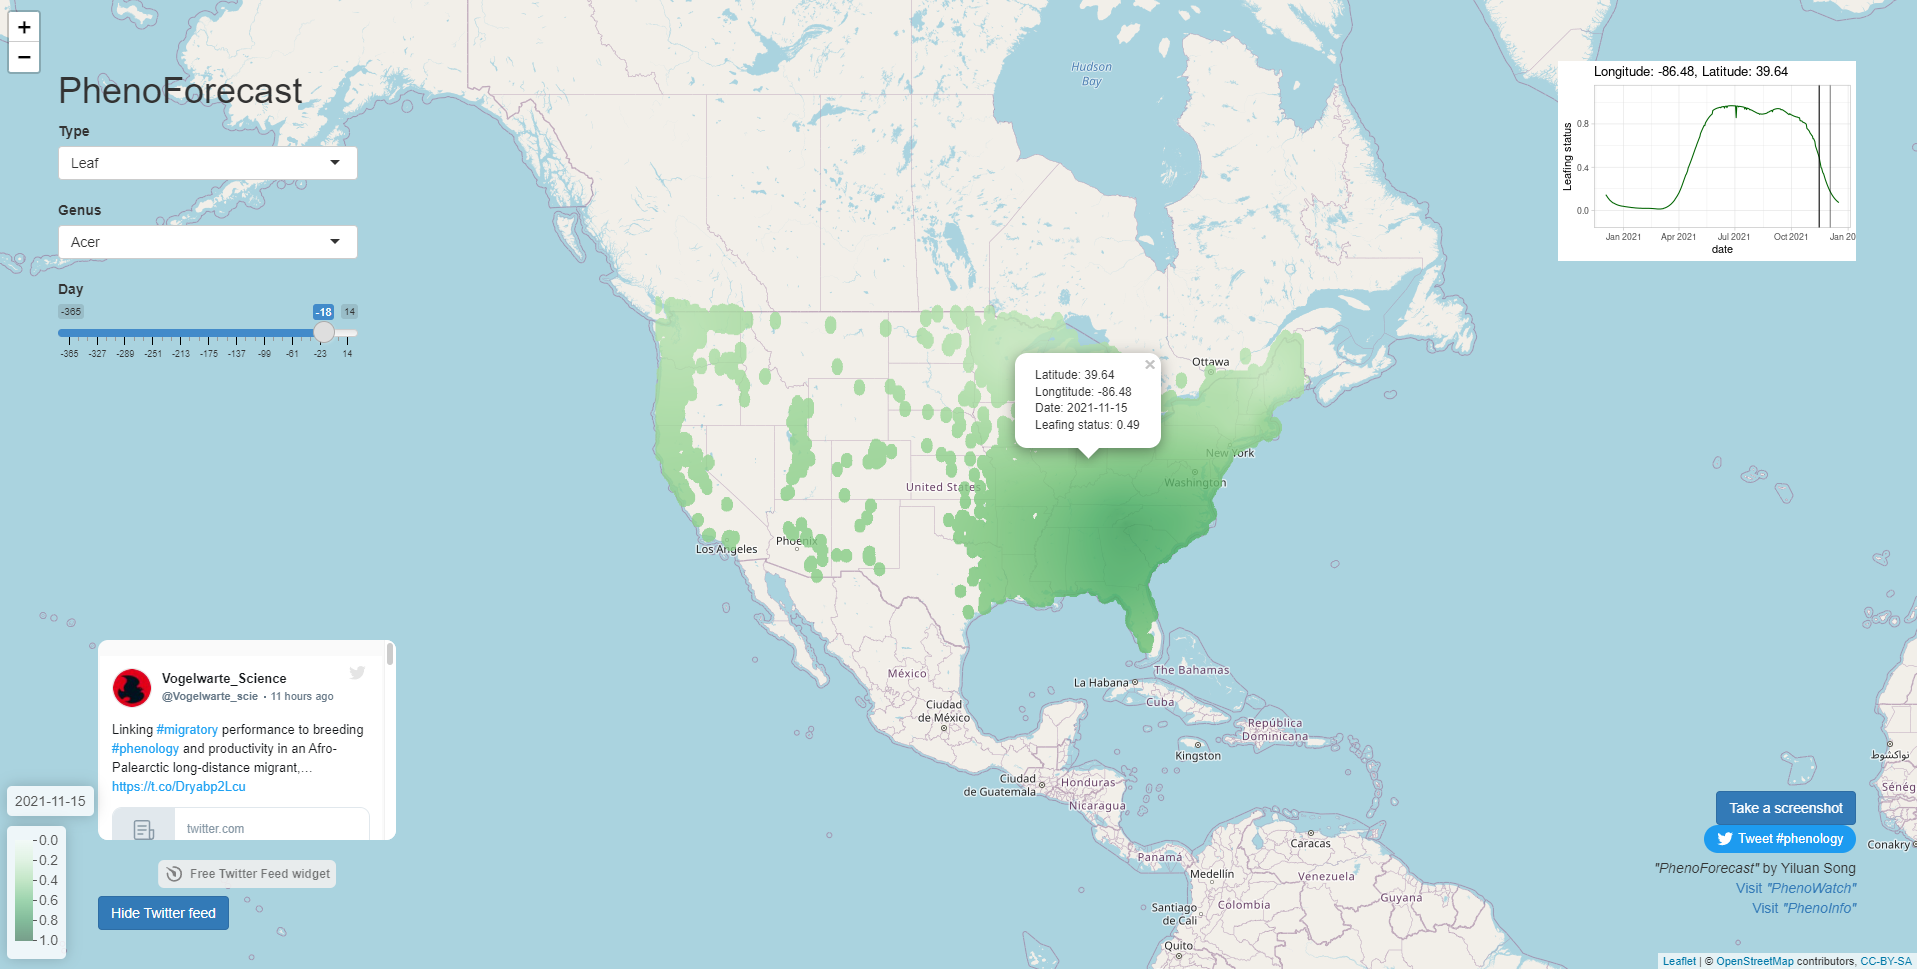
Screenshot of PhenoForecast, showing forecasts of leaf phenology.
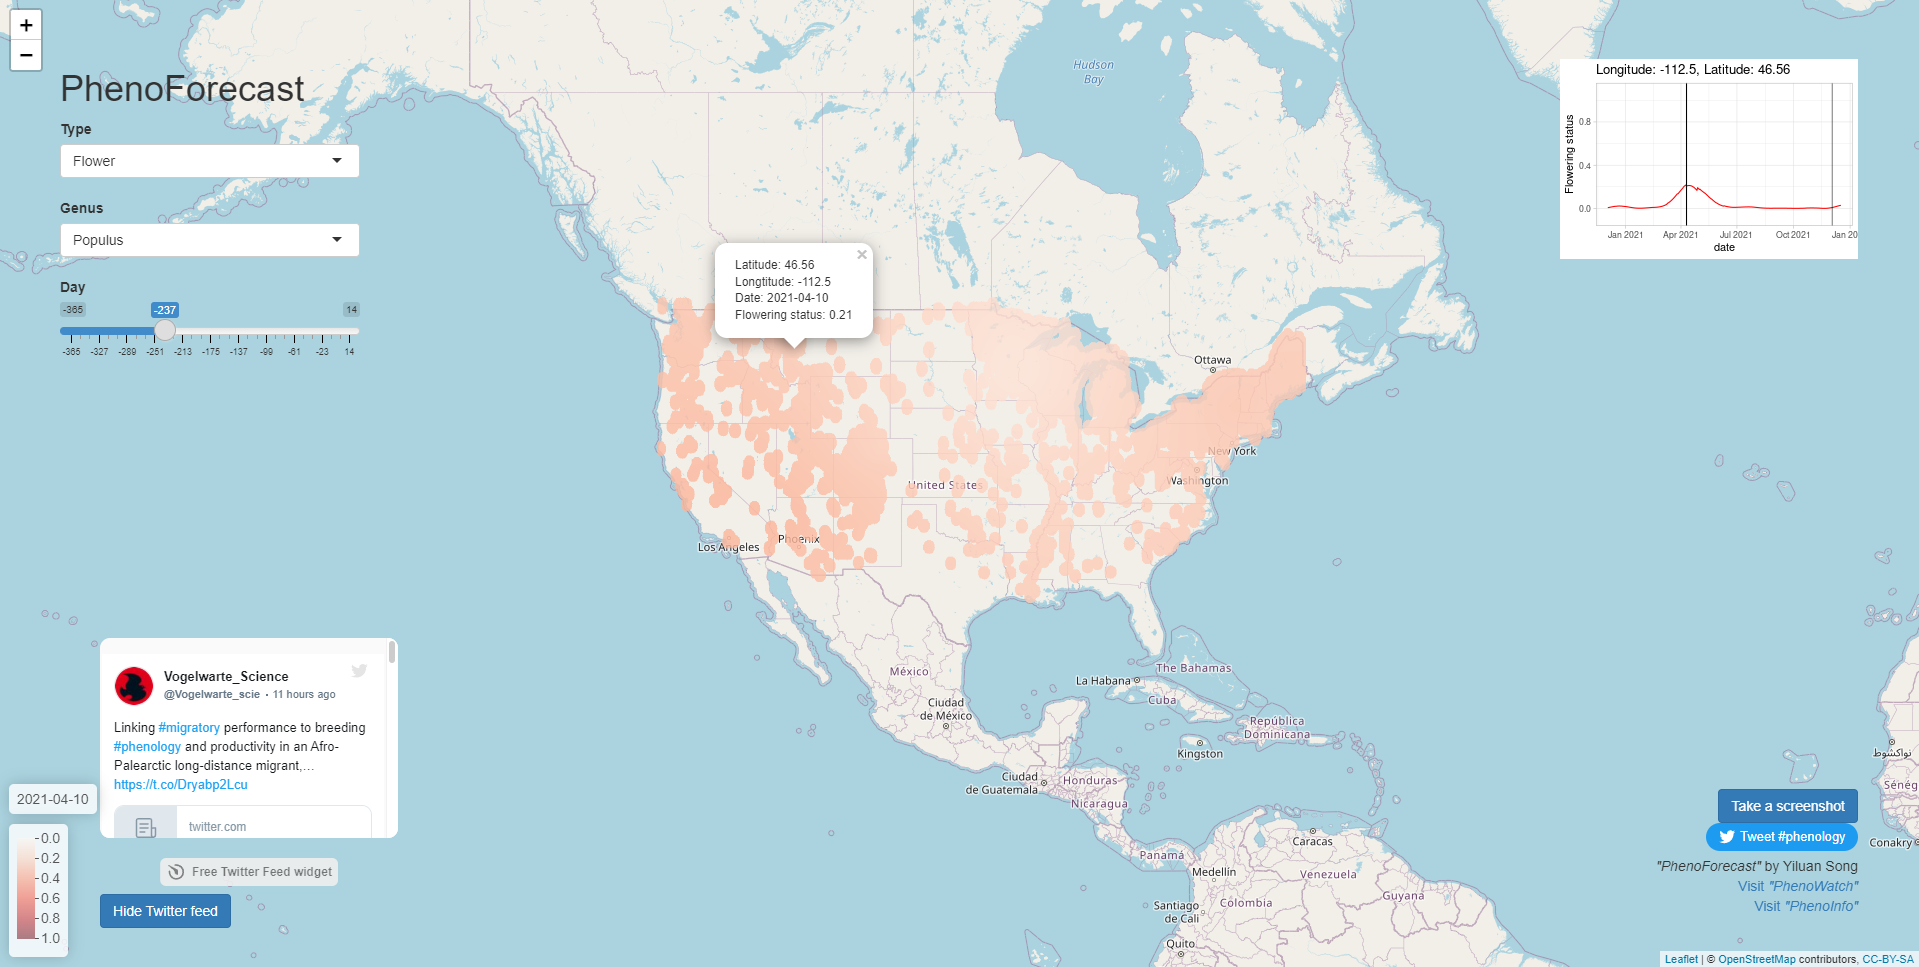
Screenshot of PhenoForecast, showing forecasts of flower phenology.
Screenshot of PhenoForecast, showing forecasts of flower phenology.
Evaluation
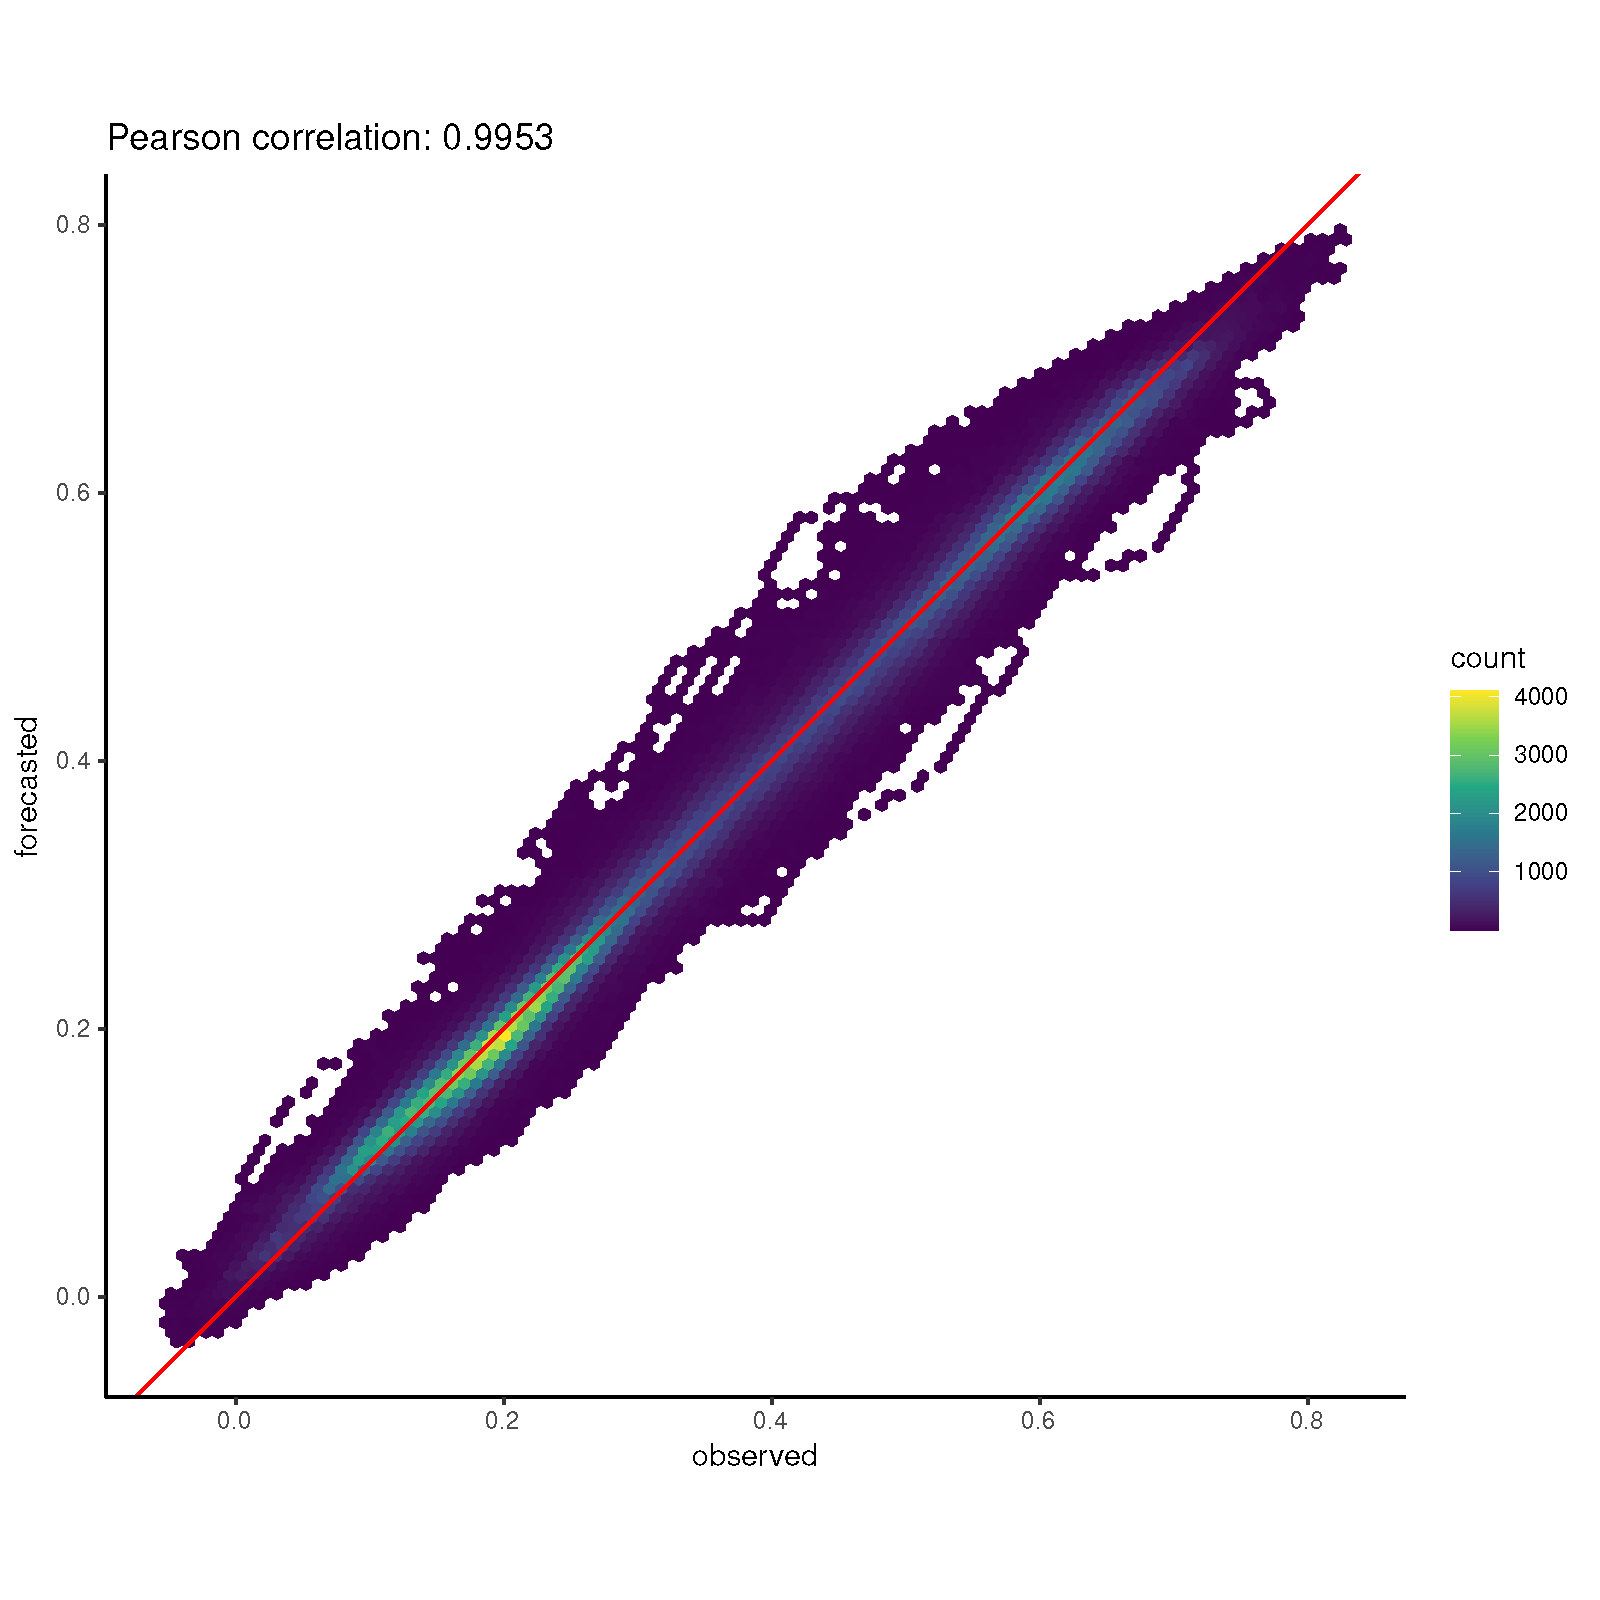
Correlation between observed and predicted EVI.
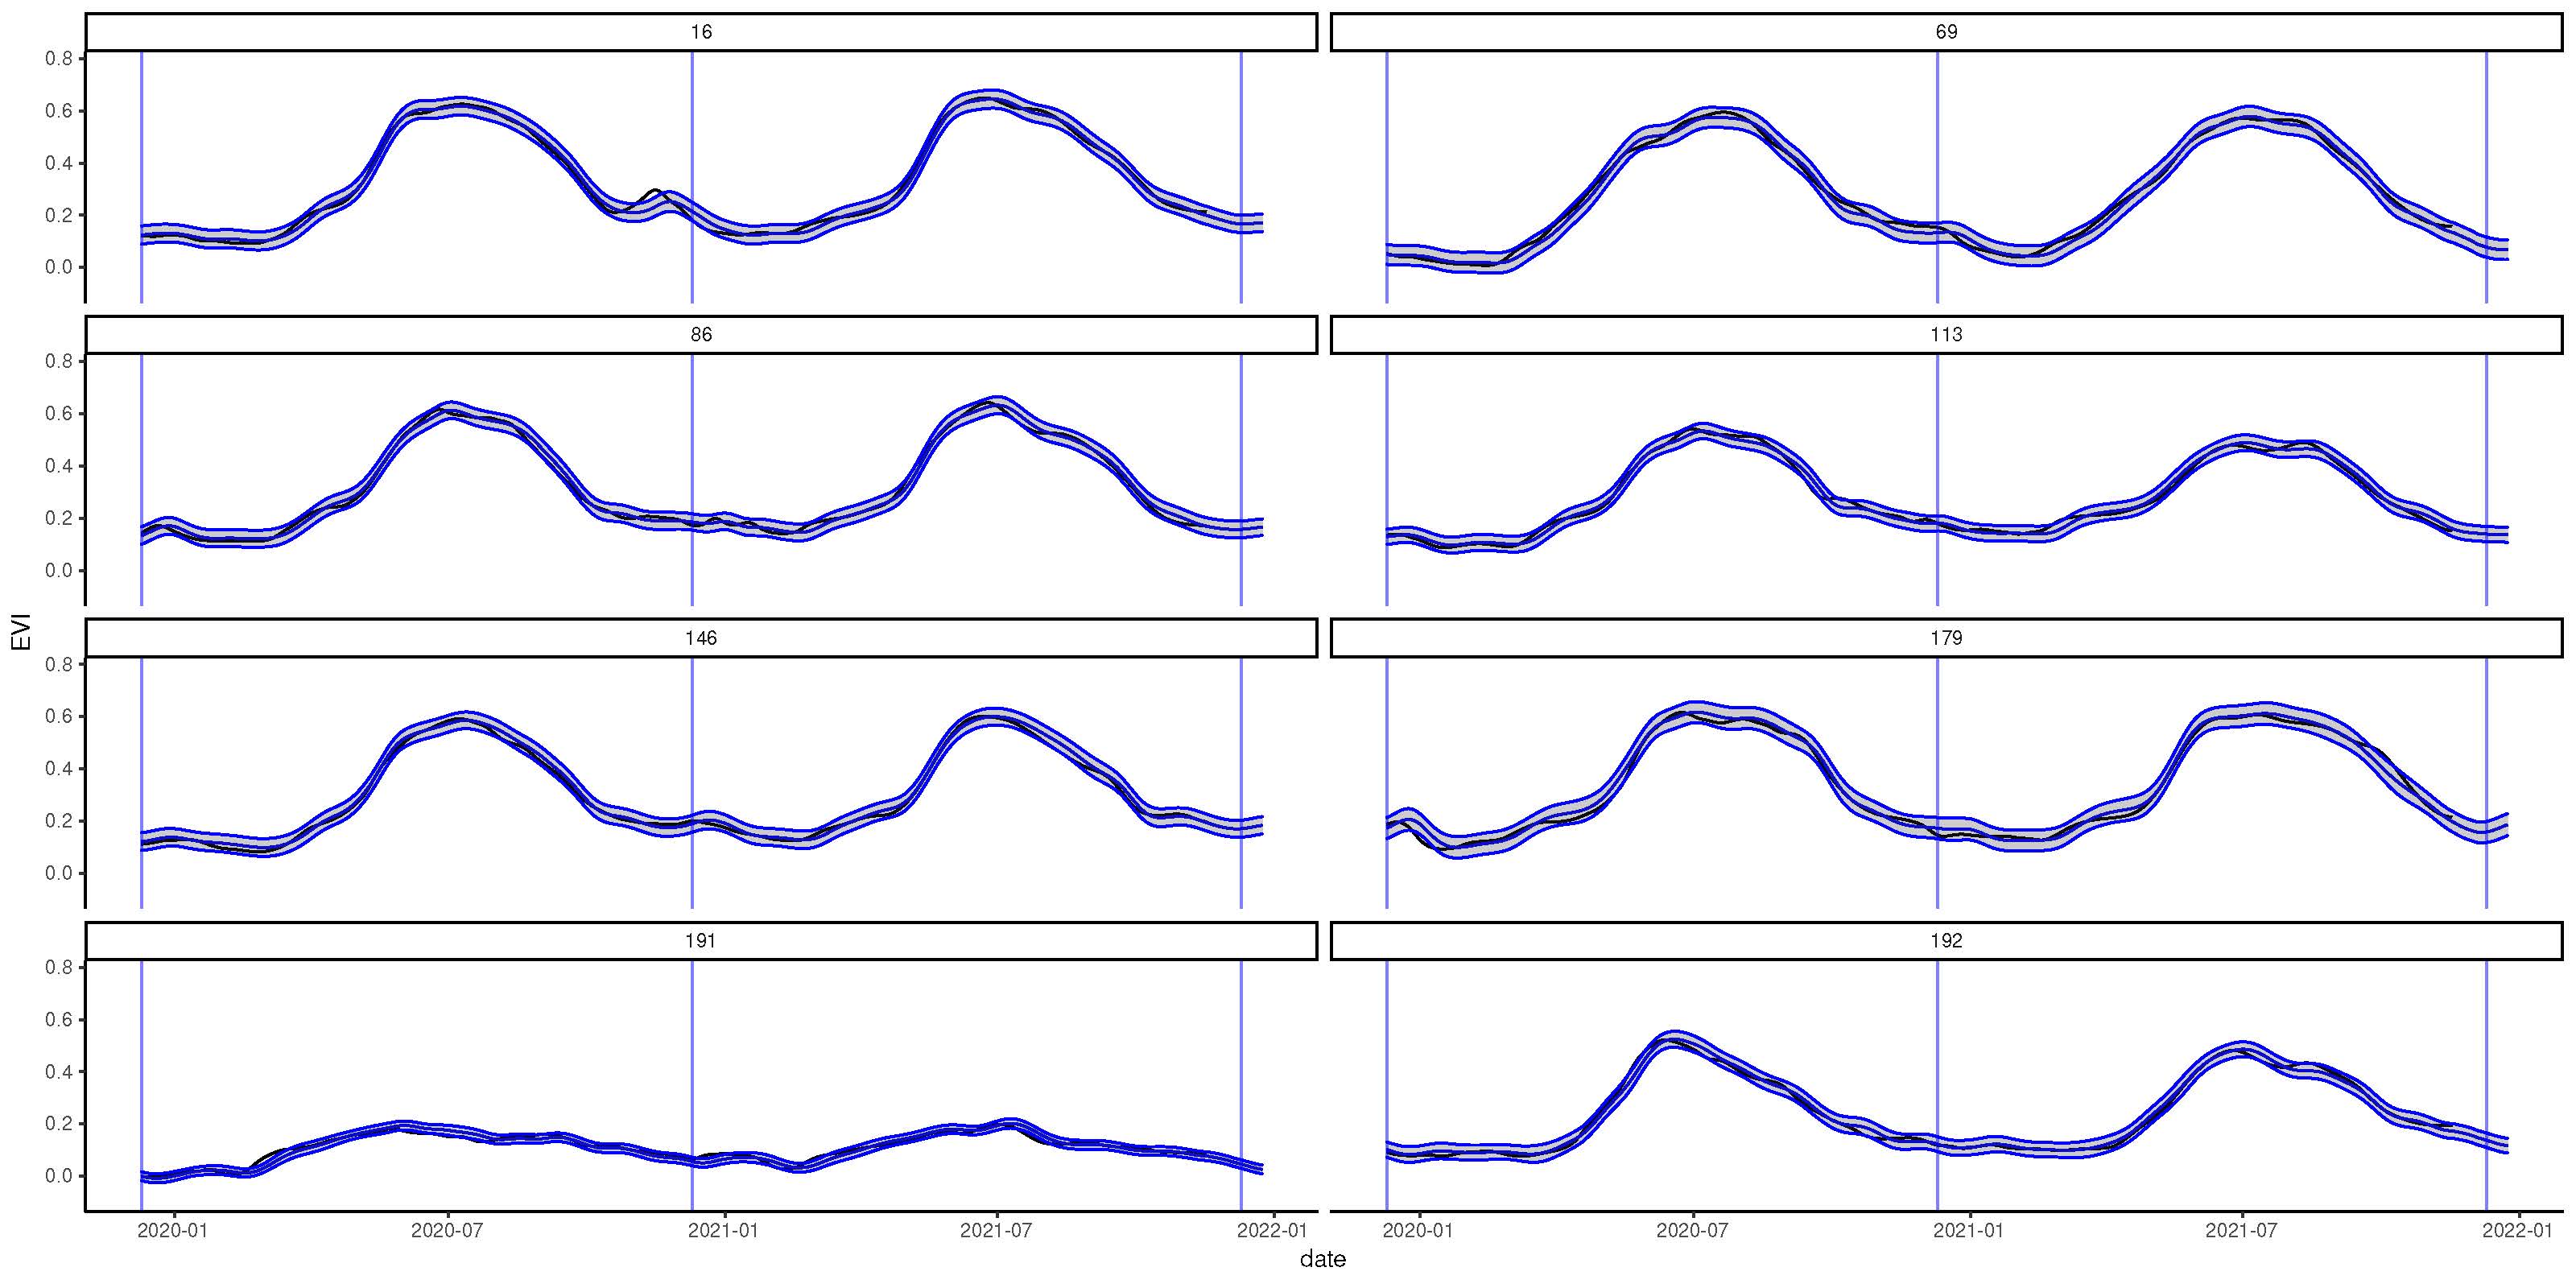
Fitted and forecasted EVI at six randomly selected sites. Black lines show observations; blue lines and ribbons show predictions with 95% intervals.